
Autoscaling pods using custom metrics in GKE
Learn how to make custom metrics available inside the Google Cloud Monitoring service and make the GKE Horizontal Pod Autoscaler use those metrics for scaling pods.


Overview of the use case
The example will be on scaling pods of a 'Selenium Grid' application based on the size of the 'sessions queue'.
The 'Selenium Grid' application is essentially composed of two components:
- hub: receive clients requests and forward them to available nodes
- nodes: are registered to the Hub and treat forwarded clients requests
When all 'nodes' pods are busy, clients requests go to the 'sessions queue'.
Our goal is to make Kubernetes HorizontalPodAutoscaler (HPA) add more 'nodes' pods depending on the size of the 'sessions queue'.
Here is the Kubernetes manifest used to deploy the 'Selenium Grid' application, based on example manifests at selenium-kubernetes-examples:
# Selenium nodes

apiVersion: apps/v1
kind: Deployment
metadata:
  name: selenium-node-firefox
  namespace: default
  labels:
    app: selenium-node-firefox
spec:
  replicas: 1
  selector:
    matchLabels:
      app: selenium-node-firefox
  template:
    metadata:
      labels:
        app: selenium-node-firefox
    spec:
      volumes:
      - name: dshm
        emptyDir:
          medium: Memory
      containers:
      - name: selenium-node-firefox
        image: selenium/node-firefox:4.18.0-20240220
        volumeMounts:
          - mountPath: /dev/shm
            name: dshm
        env:
          - name: SE_EVENT_BUS_HOST
            value: "selenium-hub"
          - name: SE_EVENT_BUS_SUBSCRIBE_PORT
            value: "4443"
          - name: SE_EVENT_BUS_PUBLISH_PORT
            value: "4442"
          - name: NODE_MAX_INSTANCES
            value: "1"
          - name: NODE_MAX_SESSION
            value: "1"
        resources:
          limits:
            memory: "250Mi"
            cpu: "0.2"
---
# Selenium Hub

apiVersion: apps/v1
kind: Deployment
metadata:
  name: selenium-hub
  namespace: default
  labels:
    app: selenium-hub
spec:
  replicas: 1
  selector:
    matchLabels:
      app: selenium-hub
  template:
    metadata:
      labels:
        app: selenium-hub
    spec:
      containers:
      - name: selenium-hub
        image: selenium/hub:4.18.0-20240220
        ports:
          - containerPort: 4444
          - containerPort: 4443
          - containerPort: 4442
        resources:
          limits:
            memory: "200Mi"
            cpu: ".2"
        livenessProbe:
          httpGet:
            path: /wd/hub/status
            port: 4444
          initialDelaySeconds: 30
          timeoutSeconds: 5
        readinessProbe:
          httpGet:
            path: /wd/hub/status
            port: 4444
          initialDelaySeconds: 30
          timeoutSeconds: 5
---
# Selenium Hub service

apiVersion: v1
kind: Service
metadata:
  name: selenium-hub
  namespace: default
  labels:
    app: selenium-hub
spec:
  ports:
  - port: 4444
    targetPort: 4444
    name: port0
  - port: 4443
    targetPort: 4443
    name: port1
  - port: 4442
    targetPort: 4442
    name: port2
  selector:
    app: selenium-hub
  type: ClusterIP
Expose the application metrics through Prometheus exporter
We first have to ensure the metrics we need are available in the Prometheus format through an HTTP endpoint.
Unfortunately, this is not already the case for our 'Selenium Grid' application. The metric we need is not available in the required format, so we have one more step to do before being able to grab the metric and push it into the 'Google Cloud Monitoring' (formerly 'Stackdriver') service.
Fortunately, someone has already created a Prometheus metrics exporter for 'Selenium Grid'. That exporter queries the 'Selenium Grid' API, creates useful metrics from the responses and exposes them in the Prometheus format through an HTTP endpoint. For more about Prometheus exporters, have a look at Writing Prometheus exporters.
Let's deploy that Prometheus exporter for exposing the 'Selenium Grid' metrics in the required format. Here is the Kubernetes manifests for that:
apiVersion: apps/v1
kind: Deployment
metadata:
  name: selenium-grid-metrics-exporter
  namespace: default
  labels:
    app: selenium-grid-metrics-exporter
spec:
  replicas: 1
  selector:
    matchLabels:
      app: selenium-grid-metrics-exporter
  template:
    metadata:
      labels:
        app: selenium-grid-metrics-exporter
    spec:
      containers:
      - name: selenium-grid-metrics-exporter
        image: gmichels/selenium-grid-exporter:v1.0.0
        ports:
          - containerPort: 8080
        command:
          - /bin/sh
          - -c
          - python ./exporter.py --grid-url http://selenium-hub:4444 --publish-interval 15 -p 8080
---
apiVersion: v1
kind: Service
metadata:
  name: selenium-grid-metrics-exporter
  namespace: default
  labels:
    app: selenium-grid-metrics-exporter
spec:
  ports:
  - port: 8080
    targetPort: 8080
    name: http
  selector:
    app: selenium-grid-metrics-exporter
  type: ClusterIP
After creating the previous Deployment and Service objects for the Prometheus exporter, let's query the service to see if the session queue size metric is available:
# Create a proxy from local machine to the exporter service
$ kubectl port-forward svc/selenium-grid-metrics-exporter --address 172.25.22.210 8080:8080 &

# Query the exporter service through the local proxy
$ curl http://172.25.22.210:8080/metrics

Handling connection for 8080
# HELP python_gc_objects_collected_total Objects collected during gc
# TYPE python_gc_objects_collected_total counter
python_gc_objects_collected_total{generation="0"} 112.0
python_gc_objects_collected_total{generation="1"} 266.0
python_gc_objects_collected_total{generation="2"} 0.0
(...)
# HELP selenium_grid_total_slots Total number of slots in the grid
# TYPE selenium_grid_total_slots gauge
selenium_grid_total_slots 1.0
# HELP selenium_grid_node_count Number of nodes in grid
# TYPE selenium_grid_node_count gauge
selenium_grid_node_count 1.0
# HELP selenium_grid_session_count Number of running sessions
# TYPE selenium_grid_session_count gauge
selenium_grid_session_count 0.0
# HELP selenium_grid_session_queue_size Number of queued sessions
# TYPE selenium_grid_session_queue_size gauge
selenium_grid_session_queue_size 0.0
# HELP selenium_node_slot_count Total number of node slots
# TYPE selenium_node_slot_count gauge
selenium_node_slot_count{deployment="selenium-node-chrome",node="chrome"} 0.0
selenium_node_slot_count{deployment="selenium-node-firefox",node="firefox"} 1.0
# HELP selenium_node_session_count Total number of node slots
# TYPE selenium_node_session_count gauge
selenium_node_session_count{deployment="selenium-node-chrome",node="chrome"} 0.0
selenium_node_session_count{deployment="selenium-node-firefox",node="firefox"} 0.0
# HELP selenium_node_usage_percent % of used node slots
# TYPE selenium_node_usage_percent gauge
selenium_node_usage_percent{deployment="selenium-node-chrome",node="chrome"} 0.0
selenium_node_usage_percent{deployment="selenium-node-firefox",node="firefox"} 0.0
We see a bunch of useful metrics for the 'Selenium Grid' application, exposed in the required Prometheus format. Very good.
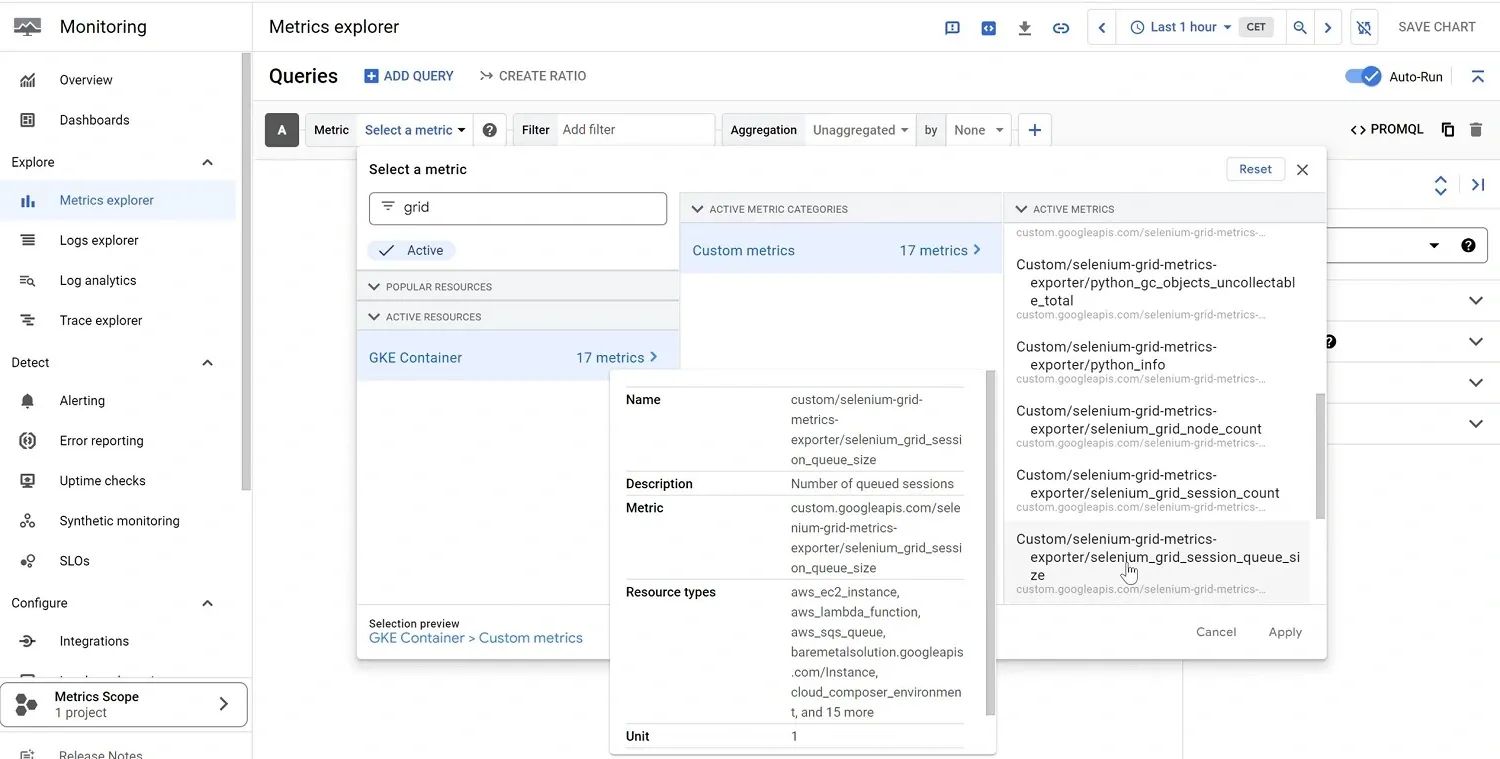
The metric about the number of queued sessions that we need for autoscaling the application pods is also available as 'selenium_grid_session_queue_size'.
Next, we will make the 'selenium_grid_session_queue_size' metric is available inside the 'Google Cloud Monitoring' service, for later use by the HPA.
Send Prometheus exporters metrics to Cloud Monitoring
Deploy Prometheus-to-sd in order to collect exported Prometheus metrics and send them to 'Google Cloud Monitoring' (formerly 'Stackdriver') service.
Here is the Kubernetes manifest for that:
apiVersion: apps/v1
kind: Deployment
metadata:
  name: selenium-grid-metrics-prometheus-to-sd
  namespace: default
  labels:
    app: selenium-grid-metrics-prometheus-to-sd
spec:
  replicas: 1
  selector:
    matchLabels:
      app: selenium-grid-metrics-prometheus-to-sd
  template:
    metadata:
      labels:
        app: selenium-grid-metrics-prometheus-to-sd
    spec:
      containers:
      - name: selenium-grid-metrics-prometheus-to-sd
        image: gcr.io/google-containers/prometheus-to-sd:v0.9.2
        ports:
          - name: profiler
            containerPort: 6060
        command:
          - /monitor
          # Scrape and export intervals are implemented in versions of prometheus-to-sd > v0.9.0
          - --scrape-interval=20s # how often in seconds metrics are pulled from Grid Hub service
          - --export-interval=30s # how often in seconds metrics are pushed to Stackdriver service
          - --stackdriver-prefix=custom.googleapis.com
          - --source=selenium-grid-metrics-exporter:http://selenium-grid-metrics-exporter:8080
          - --pod-id=$(POD_NAME)
          - --namespace-id=$(POD_NAMESPACE)
        env:
          - name: POD_NAME
            valueFrom:
              fieldRef:
                fieldPath: metadata.name
          - name: POD_NAMESPACE
            valueFrom:
              fieldRef:
                fieldPath: metadata.namespace
Let's have a look at pods statuses:
$ kubectl get pods
NAME                                                     READY   STATUS    RESTARTS   AGE
selenium-grid-metrics-exporter-57577d8869-kkfhz          1/1     Running   0          57m
selenium-grid-metrics-prometheus-to-sd-9d54fc8d7-8n4gs   1/1     Running   0          2m22s
selenium-hub-6787dc9b7d-hcsht                            1/1     Running   0          84m
selenium-node-firefox-85d5c7b75b-b7vmb                   1/1     Running   0          72m

$ kubectl logs -f pods/selenium-grid-metrics-prometheus-to-sd-9d54fc8d7-8n4gs
(...)
I0221 13:39:45.551781       1 main.go:182] Taking source configs from flags
I0221 13:39:45.551811       1 main.go:184] Taking source configs from kubernetes api server
I0221 13:39:45.551906       1 main.go:124] Built the following source configs: [0xc0002d4a90]
I0221 13:39:45.551987       1 main.go:193] Running prometheus-to-sd, monitored target is selenium-grid-metrics-exporter http://selenium-grid-metrics-exporter:8080
It seems that everything is fine. If you get 403 permissions errors at this step, there are two things you can check first:
-
if Workload Identity is enabled on the nodepool, make sure the Kubernetes service account associated to the pods running the Prometheus-to-sd container is binded to an IAM service account that have at least the 'monitoring.timeSeries.create' permission. To know how to do that, have a look at Configuring workload identity.
-
if Workload Identity is not enabled on the nodepool, make sure the 'Cloud Monitoring' feature is activated on the GKE cluster. Activating that feature will add the
https://www.googleapis.com/auth/monitoringoauth scope to newly created nodepools, allowing full read and write access to the 'Cloud Monitoring' API. Have a look at GKE oauth access scopes and All Google API oauth scopes for details. Migrate your workloads to the newly created nodepool after activating the 'Cloud Monitoring' feature. The following command:
gcloud container clusters describe <cluster-name> --zone <cluster-zone>
could be used to see the oauth scopes of the cluster nodepools by looking for 'oauthScopes' in the result.
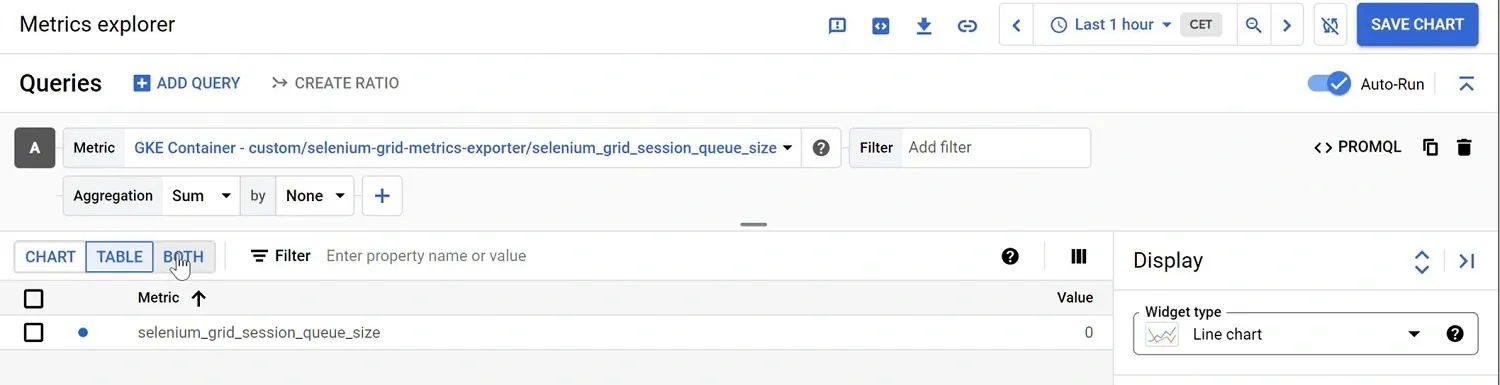
The 'selenium_grid_session_queue_size' metric should now be present inside the 'Google Cloud Monitoring' service. Let's verify by going to the Google Cloud Metrics Explorer:
Note that the
gcr.io/google-containers/prometheus-to-sdcontainer could also be deployed as a sidecar container inside the Prometheus exporter pods exposing the custom metrics we are interesting in. For more about exporting metrics to Google Cloud Monitoring service have a look at Prometheus-to-sd-examples.
Making sure the HPA can query custom/external metrics
Now that the metric we need is available inside the 'Google Cloud Monitoring' service, we need ensure the HorizontalPodAutoscaler (HPA) objects are able to read it.
For that, we need to extend the Kubernetes API service, in order to create APIs that will be used by the HPA, and then be able to get the custom/external metrics available inside the 'Google Cloud Monitoring' service.
To achieve that, we need to deploy a custom/external metrics adapter inside the GKE cluster. See custom-metrics-stackdriver-adapter for details.
Here is the command used to deploy the custom/external metrics adapter:
# If the resource type of the metrics we want to get from the new metrics APIs
# uses the new resource model: k8s_pod, k8s_node

$ kubectl apply -f https://raw.githubusercontent.com/GoogleCloudPlatform/k8s-stackdriver/master/custom-metrics-stackdriver-adapter/deploy/production/adapter_new_resource_model.yaml

# If the resource type of the metrics we want to get from the new metrics APIs
# uses the legacy resource model: gke_container

$ kubectl apply -f https://raw.githubusercontent.com/GoogleCloudPlatform/k8s-stackdriver/master/custom-metrics-stackdriver-adapter/deploy/production/adapter.yaml

# Result

namespace/custom-metrics created
serviceaccount/custom-metrics-stackdriver-adapter created
clusterrolebinding.rbac.authorization.k8s.io/custom-metrics:system:auth-delegator created
rolebinding.rbac.authorization.k8s.io/custom-metrics-auth-reader created
clusterrolebinding.rbac.authorization.k8s.io/custom-metrics-resource-reader created
deployment.apps/custom-metrics-stackdriver-adapter created
service/custom-metrics-stackdriver-adapter created
apiservice.apiregistration.k8s.io/v1beta1.custom.metrics.k8s.io created
apiservice.apiregistration.k8s.io/v1beta2.custom.metrics.k8s.io created
apiservice.apiregistration.k8s.io/v1beta1.external.metrics.k8s.io created
Warning: resource clusterroles/external-metrics-reader is missing the kubectl.kubernetes.io/last-applied-configuration annotation which is required by kubectl apply. kubectl apply should only be used on resources created declaratively by either kubectl create --save-config or kubectl apply. The missing annotation will be patched automatically.
clusterrole.rbac.authorization.k8s.io/external-metrics-reader configured
clusterrolebinding.rbac.authorization.k8s.io/external-metrics-reader created
After that, two new metrics APIs will be available with the following API groups: 'external.metrics.k8s.io' and 'custom.metrics.k8s.io'.
Let's have a look at the custom/external metrics adapter logs:
$ kubectl get all -n custom-metrics

NAME                                                     READY   STATUS    RESTARTS   AGE
pod/custom-metrics-stackdriver-adapter-df7d6cfcd-tkp45   1/1     Running   0          3m21s

NAME                                         TYPE        CLUSTER-IP   EXTERNAL-IP   PORT(S)   AGE
service/custom-metrics-stackdriver-adapter   ClusterIP   10.1.0.208   <none>        443/TCP   3m20s

NAME                                                 READY   UP-TO-DATE   AVAILABLE   AGE
deployment.apps/custom-metrics-stackdriver-adapter   1/1     1            1           3m22s

NAME                                                           DESIRED   CURRENT   READY   AGE
replicaset.apps/custom-metrics-stackdriver-adapter-df7d6cfcd   1         1         1       3m22s

$ kubectl logs -f pods/custom-metrics-stackdriver-adapter-df7d6cfcd-tkp45 -n custom-metrics

I0222 09:38:55.812226       1 adapter.go:200] serverOptions: {false true true false false   false false}
I0222 09:38:55.812362       1 adapter.go:210] ListFullCustomMetrics is disabled, which would only list 1 metric resource to reduce memory usage. Add --list-full-custom-metrics to list full metric resources for debugging.
I0222 09:38:59.132069       1 serving.go:341] Generated self-signed cert (apiserver.local.config/certificates/apiserver.crt, apiserver.local.config/certificates/apiserver.key)
I0222 09:39:01.415941       1 secure_serving.go:256] Serving securely on [::]:443
I0222 09:39:01.416012       1 requestheader_controller.go:169] Starting RequestHeaderAuthRequestController
I0222 09:39:01.416025       1 shared_informer.go:240] Waiting for caches to sync for RequestHeaderAuthRequestController
I0222 09:39:01.416068       1 dynamic_serving_content.go:129] "Starting controller" name="serving-cert::apiserver.local.config/certificates/apiserver.crt::apiserver.local.config/certificates/apiserver.key"
I0222 09:39:01.416127       1 tlsconfig.go:240] "Starting DynamicServingCertificateController"
I0222 09:39:01.416253       1 configmap_cafile_content.go:201] "Starting controller" name="client-ca::kube-system::extension-apiserver-authentication::client-ca-file"
I0222 09:39:01.416259       1 shared_informer.go:240] Waiting for caches to sync for client-ca::kube-system::extension-apiserver-authentication::client-ca-file
I0222 09:39:01.416273       1 configmap_cafile_content.go:201] "Starting controller" name="client-ca::kube-system::extension-apiserver-authentication::requestheader-client-ca-file"
I0222 09:39:01.416278       1 shared_informer.go:240] Waiting for caches to sync for client-ca::kube-system::extension-apiserver-authentication::requestheader-client-ca-file
I0222 09:39:01.516235       1 shared_informer.go:247] Caches are synced for RequestHeaderAuthRequestController
I0222 09:39:01.516354       1 shared_informer.go:247] Caches are synced for client-ca::kube-system::extension-apiserver-authentication::requestheader-client-ca-file
I0222 09:39:01.536396       1 shared_informer.go:247] Caches are synced for client-ca::kube-system::extension-apiserver-authentication::client-ca-file
It seems that things are working properly. We can see that the metric we need is now available through the new metrics APIs by doing:
$ kubectl get --raw "/apis/external.metrics.k8s.io/v1beta1/namespaces/default/custom.googleapis.com|selenium-grid-metrics-exporter|selenium_grid_session_queue_size" | jq

{
  "kind": "ExternalMetricValueList",
  "apiVersion": "external.metrics.k8s.io/v1beta1",
  "metadata": {},
  "items": [
    {
      "metricName": "custom.googleapis.com|selenium-grid-metrics-exporter|selenium_grid_session_queue_size",
      "metricLabels": {
        "resource.labels.cluster_name": "mygkecluster",
        "resource.labels.container_name": "",
        "resource.labels.instance_id": "gke-mygkecluster-main-486d49bd-w6gb",
        "resource.labels.namespace_id": "default",
        "resource.labels.pod_id": "selenium-grid-metrics-prometheus-to-sd-9d54fc8d7-twctc",
        "resource.labels.project_id": "wise-bulk-410910",
        "resource.labels.zone": "us-central1-c",
        "resource.type": "gke_container"
      },
      "timestamp": "2024-02-22T10:45:16Z",
      "value": "5"
    }
  ]
}

# or

$ kubectl get --raw "/apis/custom.metrics.k8s.io/v1beta1" | jq | grep -i "selenium_grid_session_queue_size"
Autoscaling using the custom/external metrics
Now we can configure the HPA to use the custom/external metric for scaling 'Selenium Grid nodes' pods. Here is the manifest for creating the HPA ressource.
apiVersion: autoscaling/v2
kind: HorizontalPodAutoscaler
metadata:
  name: selenium-grid-nodes
  namespace: default
spec:
  scaleTargetRef:
    apiVersion: apps/v1
    kind: Deployment
    name: selenium-node-firefox
  minReplicas: 1
  maxReplicas: 3
  metrics:
  - type: External
    external:
      metric:
        name: custom.googleapis.com|selenium-grid-metrics-exporter|selenium_grid_session_queue_size
      target:
        type: Value
        value:
After deploying the HPA, we should see the sessions queue size in the 'TARGET' column as shown below, which means that the HPA is now able to use the 'selenium_grid_session_queue_size' custom metric for autoscaling the 'Selenium Grid' application 'nodes' pods.
$ kubectl get hpa
NAME                  REFERENCE                          TARGETS   MINPODS   MAXPODS   REPLICAS   AGE
selenium-grid-nodes   Deployment/selenium-node-firefox   10/3      1         3         3          58m
Here is what we see when the HPA is not able to get the sessions queue size metric value:
$ kubectl get hpa
NAME                  REFERENCE                          TARGETS       MINPODS   MAXPODS   REPLICAS   AGE
selenium-grid-nodes   Deployment/selenium-node-firefox   <unknown>/3   1         3         0          16s

$ kubectl describe hpa
Name: selenium-grid-nodes
Namespace: default
(...)
Reference: Deployment/selenium-node-firefox
Metrics: ( current / target )
  "custom.googleapis.com|selenium-grid-metrics-exporter|selenium_grid_session_queue_size" (target value):  <unknown> / 3
Min replicas: 1
Max replicas: 3
Deployment pods: 1 current / 1 desired
Conditions:
  Type            Status  Reason                   Message
  ----            ------  ------                   -------
  AbleToScale     True    ReadyForNewScale         recommended size matches current size
  ScalingActive   False   FailedGetExternalMetric  the HPA was unable to compute the replica count: unable to get external metric default/custom.googleapis.com|selenium-grid-metrics-exporter|selenium_grid_session_queue_size/nil: unable to fetch metrics from external metrics API: the server could not find the requested resource (get custom.googleapis.com|selenium-grid-metrics-exporter|selenium_grid_session_queue_size.external.metrics.k8s.io)
  ScalingLimited  False   DesiredWithinRange       the desired count is within the acceptable range
Events:
  Type     Reason                   Age               From                       Message
  ----     ------                   ----              ----                       -------
  Warning  FailedGetExternalMetric  6s (x2 over 21s)  horizontal-pod-autoscaler  unable to get external metric default/custom.googleapis.com|selenium-grid-metrics-exporter|selenium_grid_session_queue_size/nil: unable to fetch metrics from external metrics API: the server could not find the requested resource (get custom.googleapis.com|selenium-grid-metrics-exporter|selenium_grid_session_queue_size.external.metrics.k8s.io)
Tuning the HPA
To customize the 'scale out' and 'scale in' behaviors for the HPA, here is the hpa-v2 api reference section about that.
How often the HPA pulls metrics from metrics servers is a parameter of the kube-controller-manager ('--horizontal-pod-autoscaler-sync-period') and is by default set to '15s'.
To change Prometheus-to-sd component scrape and export interval, the '--scrape-interval' and '--export-interval' parameters can be used with the 'monitor' command. See prometheus-to-sd-scrape-interval-vs-export-interval and prometheus-to-sd-main-go-file for details.